Why a radar, and why now then?
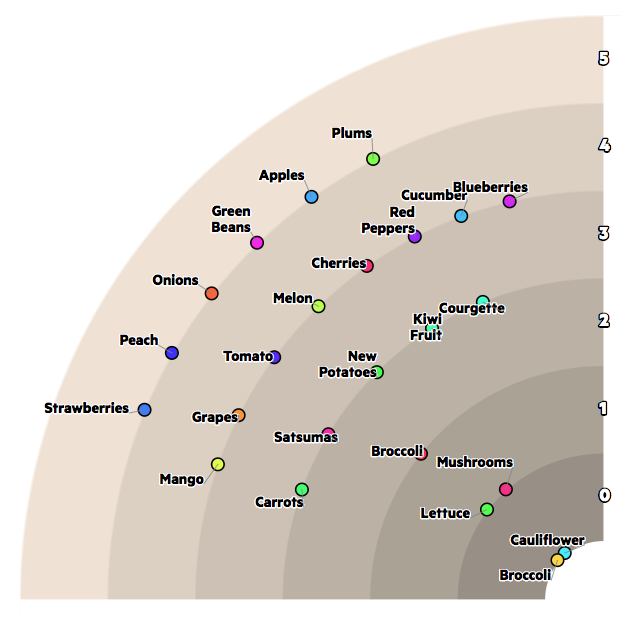
It seemed every internal team wanted their own radar-themed view of their projects, and were grumbling about the effort needed to maintain them manually. Greatly inspired by the Thoughtworks Radar, we saw an opportunity to build a tool to automate the generation of radar displays, run and configured in-browser, taking advantage of an in-house service which exports data from Google Spreadsheets as a JSON feed. Each team could maintain (and share) their projects’ details in a spreadsheet, and launch the radar display via a link within the spreadsheet.
How?
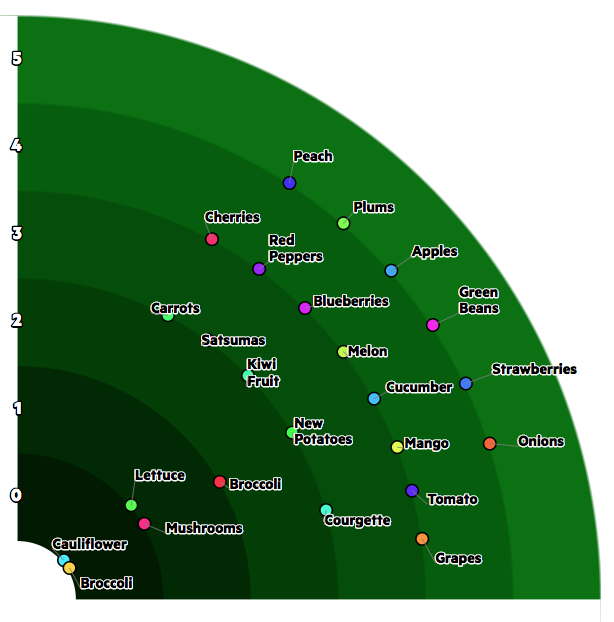
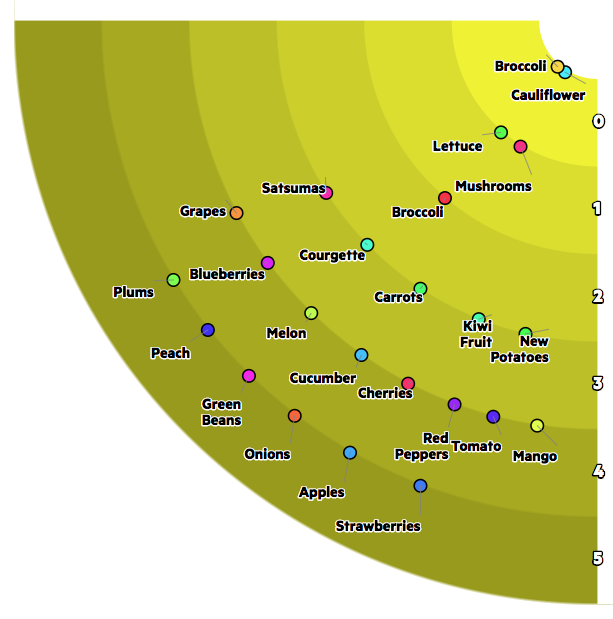
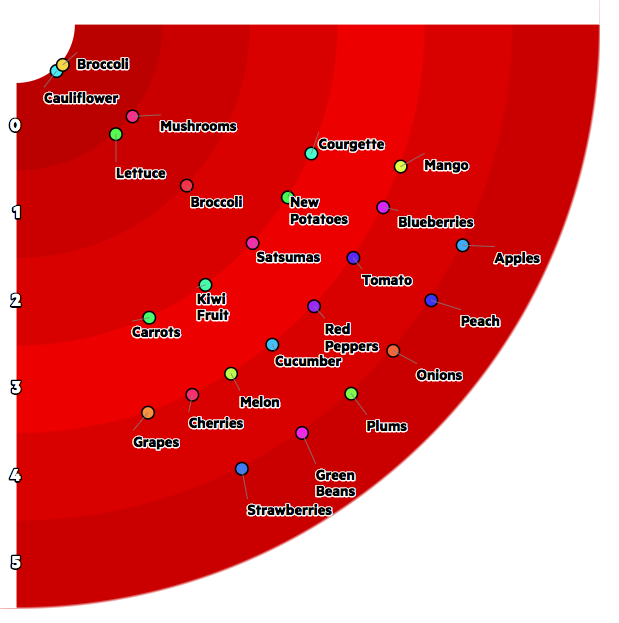
The FT Labs Tech radar tool is built using Javascript using the D3 library’s force diagram, served as a static page from Github Pages. The radar is configurable via a display dashboard, via url parameters (including one to hide the dashboard…), and via parameters embedded in the JSON data.

Nodes in the display are (initially) placed using a combination of attraction (to the section they should be in) and repulsion (from each other). Labels attempt to avoid all other labels and nodes, whilst still keeping close to their own node, in order to remain visible and relevant.
Usage
Configure the radar url with a source of JSON data, e.g. the handy demo data file,
https://labs.ft.com/tech-radar/?json=https://labs.ft.com/tech-radar/demo.json
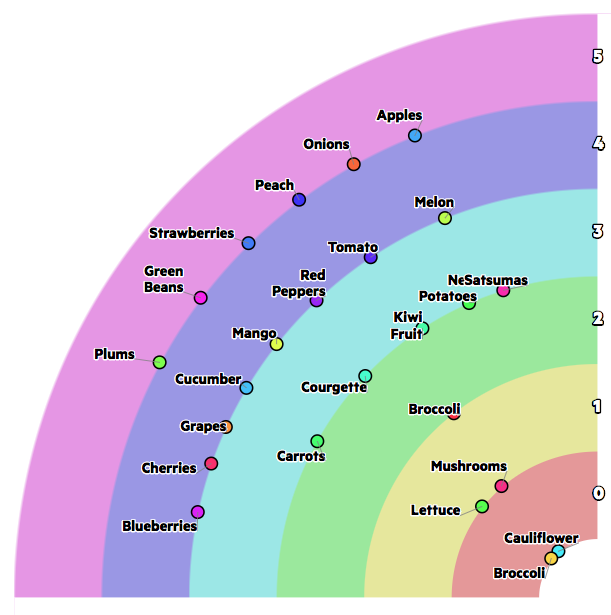
The data file must have a field called ‘name’. If there are any configs specified in the file, they are set via the configvalue field, which is null otherwise. In the basic demo, it specifies the ‘rainbow’ colour scheme for the rings {"name": "ringcol", "configvalue": "rainbow"}, and the field called ‘tastiness’ as the default data field {"name": "sortcol", "configvalue": "tastiness"}. The other data fields will be available in the dashboard for configuring the display.
Within the FT, create (or update) a simple dataset with named columns in a google spreadsheet, export it as a JSON feed using the in-house service, and configure the radar url with the name and id of that entry. See the Bertha repo.
When viewing the radar display, all the parameters are adjustable directly in the dashboard, in turn updating the url of the radar page. The url can be shared and the recipient will get the same display.
After the display has rendered, with the nodes and labels positioned automatically, they can be repositioned individually. The user will need to take a screenshot to accurately preserve such a manually adjusted layout, since those manual adjustments are not persisted in the url.
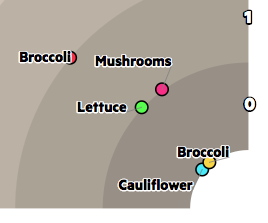
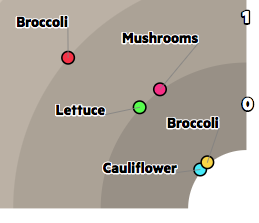
In the display, an item can be expanded in the table, and both the dashboard and the table can be removed from the display completely.
Features and requirements
We had some noble users who suffered through the early versions and helped us shape the final version.
Their main requirements were:
- Every node should be in the correct sector
- Choosing their own colour scheme
- Being able to manually adjust the nodes and labels
- And, somewhat unexpectedly, being able to vary the origin of the quadrant
The default settings should just work (™), but it is possible to override almost all aspects of the display, including:
- The balance of repulsion vs attraction
- Colour(s), colour gradient, and crystallisation row (where the colour brightness peaks at one of the middle rows, rather than an end row)
- Which datasource(s). It is possible to combine multiple data sources into one display.
- Which non-default columns to use as the display dimensions, and their sort order
- Filtering the data
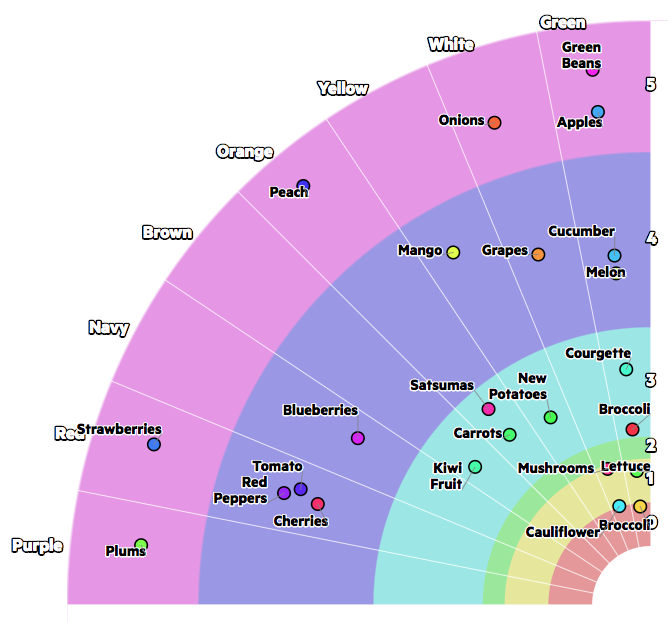
- Sub-dividing the data into sectors (using a second sort field defined by the param ‘segment’)
- Which corner is the origin of the radar quadrant
- Any of the CSS
- And lots more. See the repo README for details.
And, when all is said and done, every node, node label, and name can be individually repositioned and locked into place, if their default placements are not satisfactory.
Difficulties
Physics
- Trying to stay within bounded regions using attraction+repulsion. We had to resort to a bit of maths at the boundaries and forcibly repatriate run-away nodes into the quadrant. This can easily happen even when the region is not particularly crowded.
- Fitting lots of nodes into tight corners. As has no doubt been a problem for everyone who tries to build radar-themed displays, space gets tight near the origin, especially when specifying a segment field.
- Keeping the labels from overlapping. We used invisible nodes in D3 to repel labels from all other labels and nodes (except their own node).
UX
- Juggling a large set of parameters to find a combination that worked well in most circumstances. For example, this more fancy example.
- Not succumbing to feature creep (News Update: we succumbed).
- Handling the explosion in config parameters, many of which were purely experimental, and trying to avoid the configuration becoming a UX disaster. Designing a useful, usable dashboard was a significant challenge.
Browsers
- Cross-domain issues. The JSON file needs to come from the same domain.
- HTTPS. The JSON file url needs to be HTTPS if the radar page is on HTTPS.
What’s Next?
Despite there already being far too many configurable features, the urge is obviously to continue to add more. We won’t be doing so, unless internal users clamour for it. Meanwhile, this code is open source, so…
