Interested in the field of Machine Learning and guided by the FT's goal of adding further value through personalisation, we saw an opportunity to have a go at creating our own FT Labs content recommendation engine™. Our early estimates warned this could be quite difficult, and we were right.
What did we do?
Data is the cornerstone of any Machine Learning project. If you don't spend the time to gather, prune and enrich your data you will be left with low quality data - Garbage in, garbage out. Through all of our reading and watching on how to get started with ML projects it was greatly impressed upon us that understanding the data and its context is essential.
The best metrics for evaluating/calculating personalisation would be any data points generated by a user. Therefore we would need to get hold of select user behaviour data sets, not currently open to us. Namely:
- Follows/unfollows - user action of choosing to follow an FT topic or the reverse
- Saves/unsaves - user action of choosing to save an article for later or the opposite
- Reads - articles a user has read
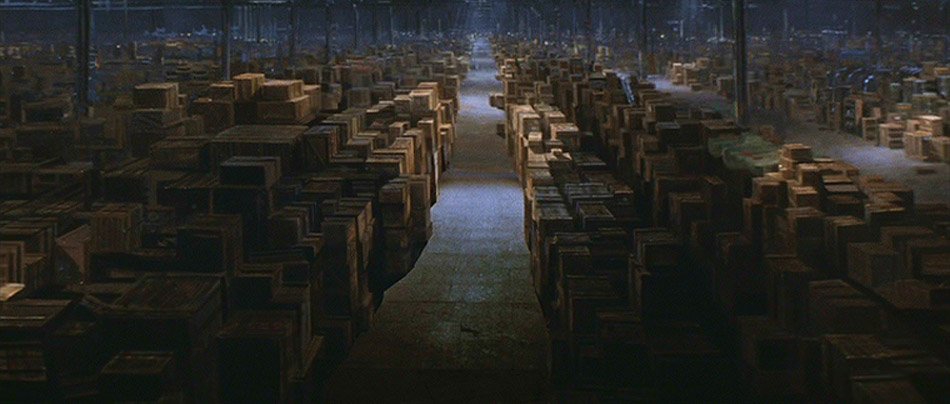
Fortunately we were granted the keys to the FT shared large data solution™, unfortunately there are so many datasets contained within it was hard to know where to start.
FT Data teams to the rescue! Members of the Data Science and Data Support departments became our trusted guides, leading us to the data we sought. Data Science also introduced us to R which was invaluable in processing and manipulating data of this size. We also built upon Data Science's wealth of tools to get our own scripts up and running.
These data sets were immense. Over a number of weeks we looked at follows/unfollows and saves/unsaves in turn.
User topic follows
We discovered with user topic follows that we could use k-means clustering to group topics together, based on the users who follow them, and allow the ML to make groupings for humans to label later. We initially wanted to group several types (people, topics etc) together but the compute costs were too high for our initial investigation, so we settled for topics (for now).
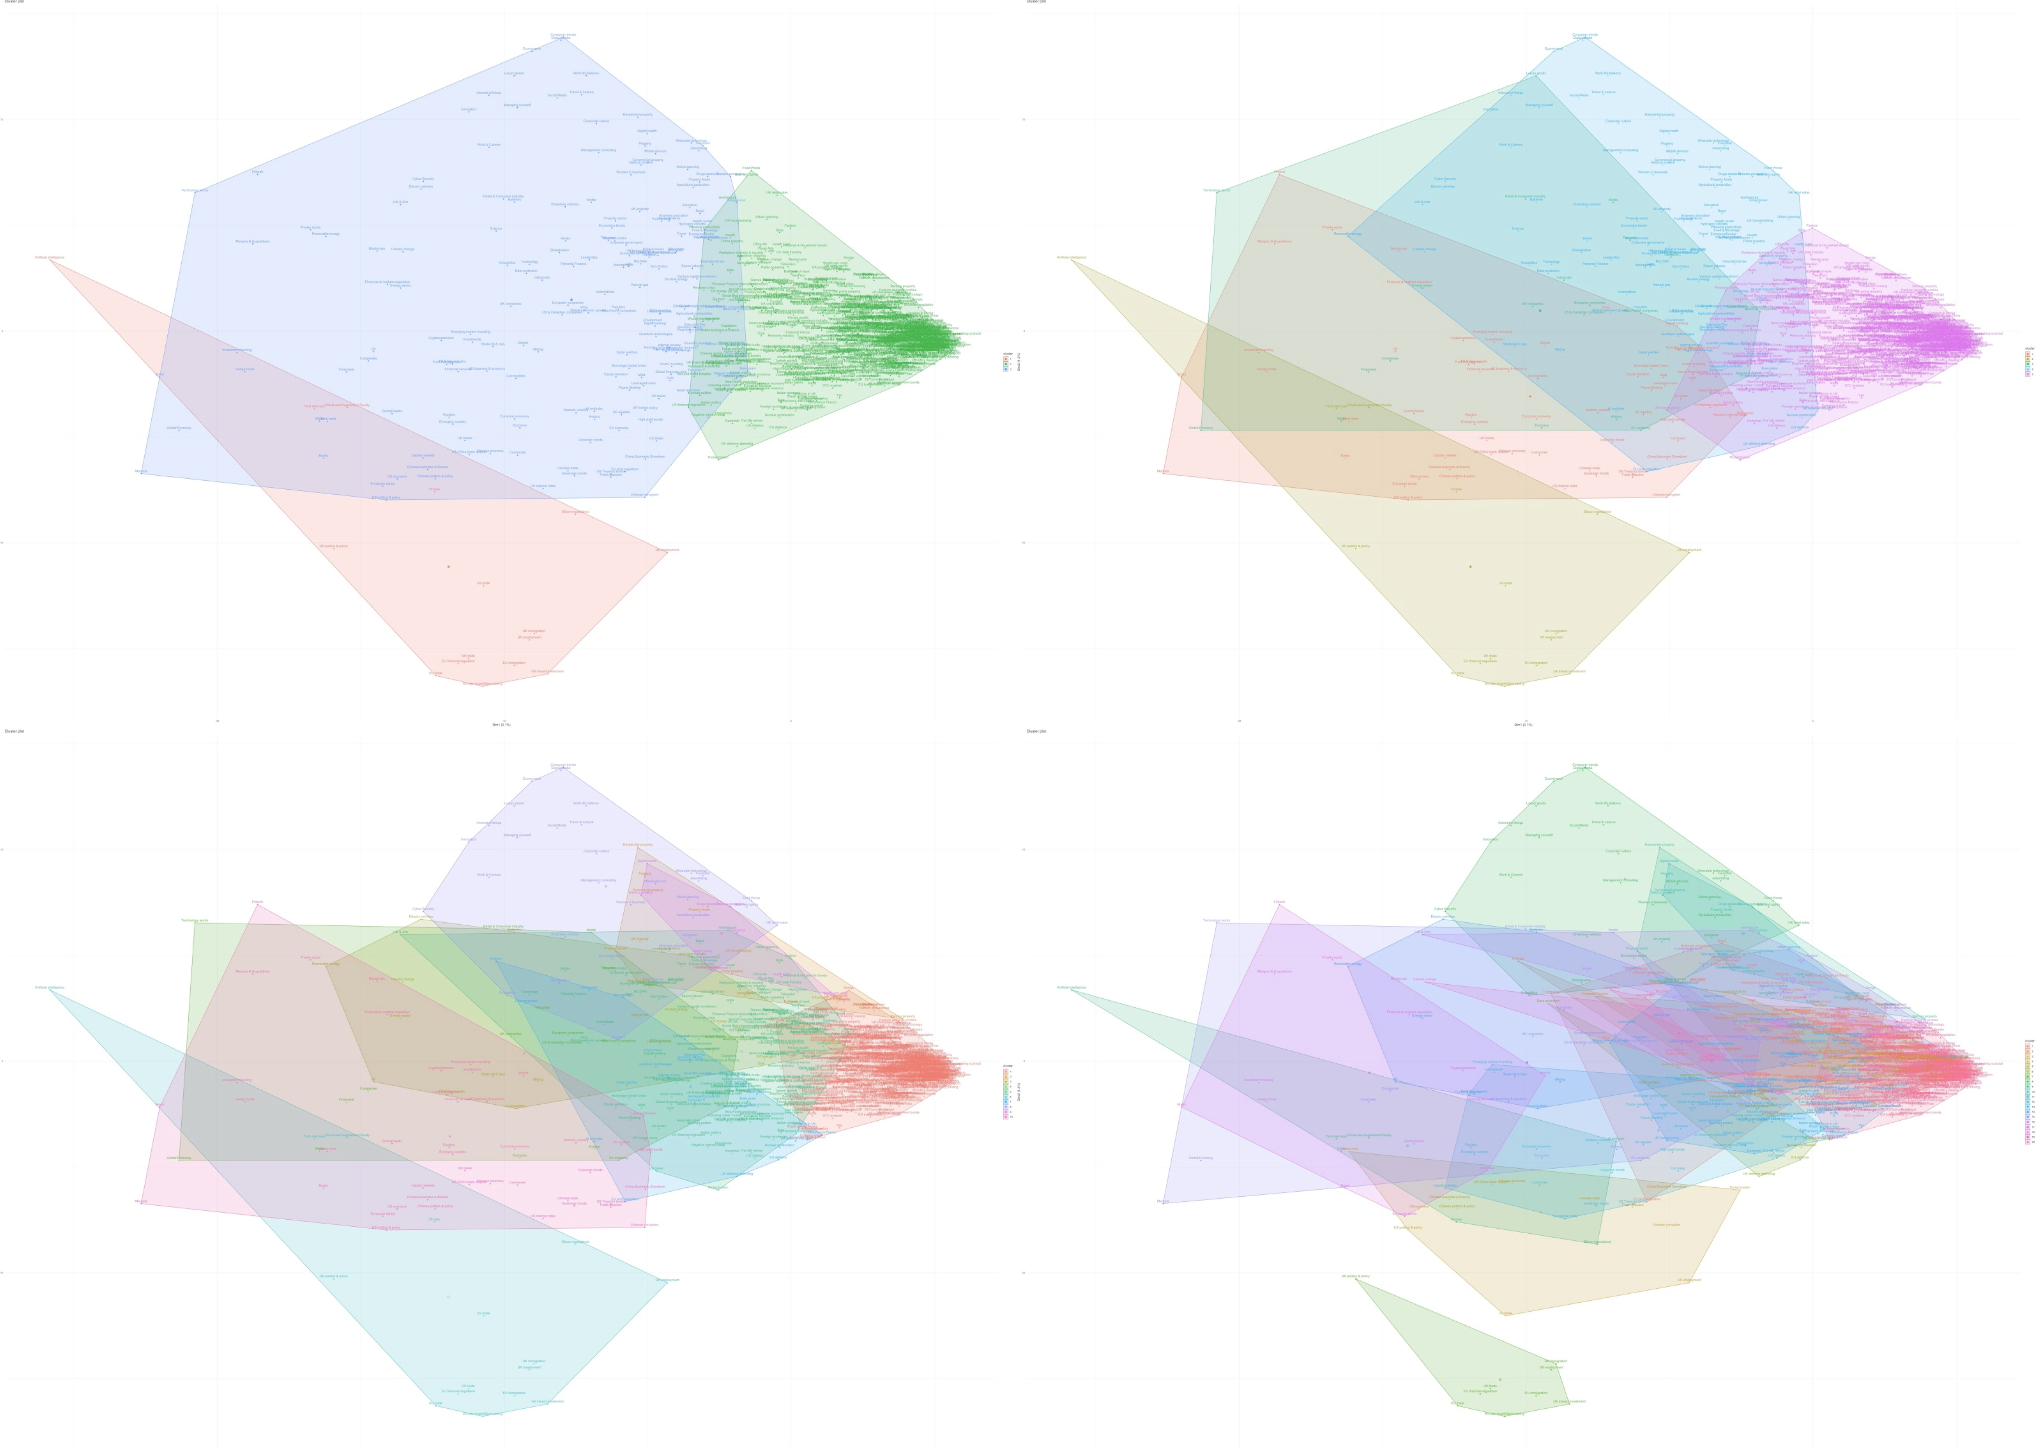
Depicted in the image above are the 3, 5, 10 & 20 cluster grouping versions of FT topics. Cluster numbers were selected by using the elbow method of estimating the optimal number of clusters in a collection of data.
Each version is the number of groups a human gave to the k-means algorithm and said "put all the topics into this number of groups". Each users follows are used as vectors to calculate the topics position, allowing similar patterns of topic following to be detected by the algorithm.
You can see that some groups change quite a bit as the number of clusters go up however others (like the trapezoid in the bottom left) are so relevant and separate from other topics that they hold onto their group cohesiveness even as the number of clusters increases.
This gave us a collection of topic groups that we could use to suggest new topics to users. "You follow this topic but what about the others in the group". While very useful, these clusters only represent one part of a recommendation, we'd need to look deeper to refine the recommendations.
As we further understood the data and improved our R skills we took a look at follows vs unfollows. This would turn out to take a lot more data massaging to ready the data for analysis.
Follows/unfollows
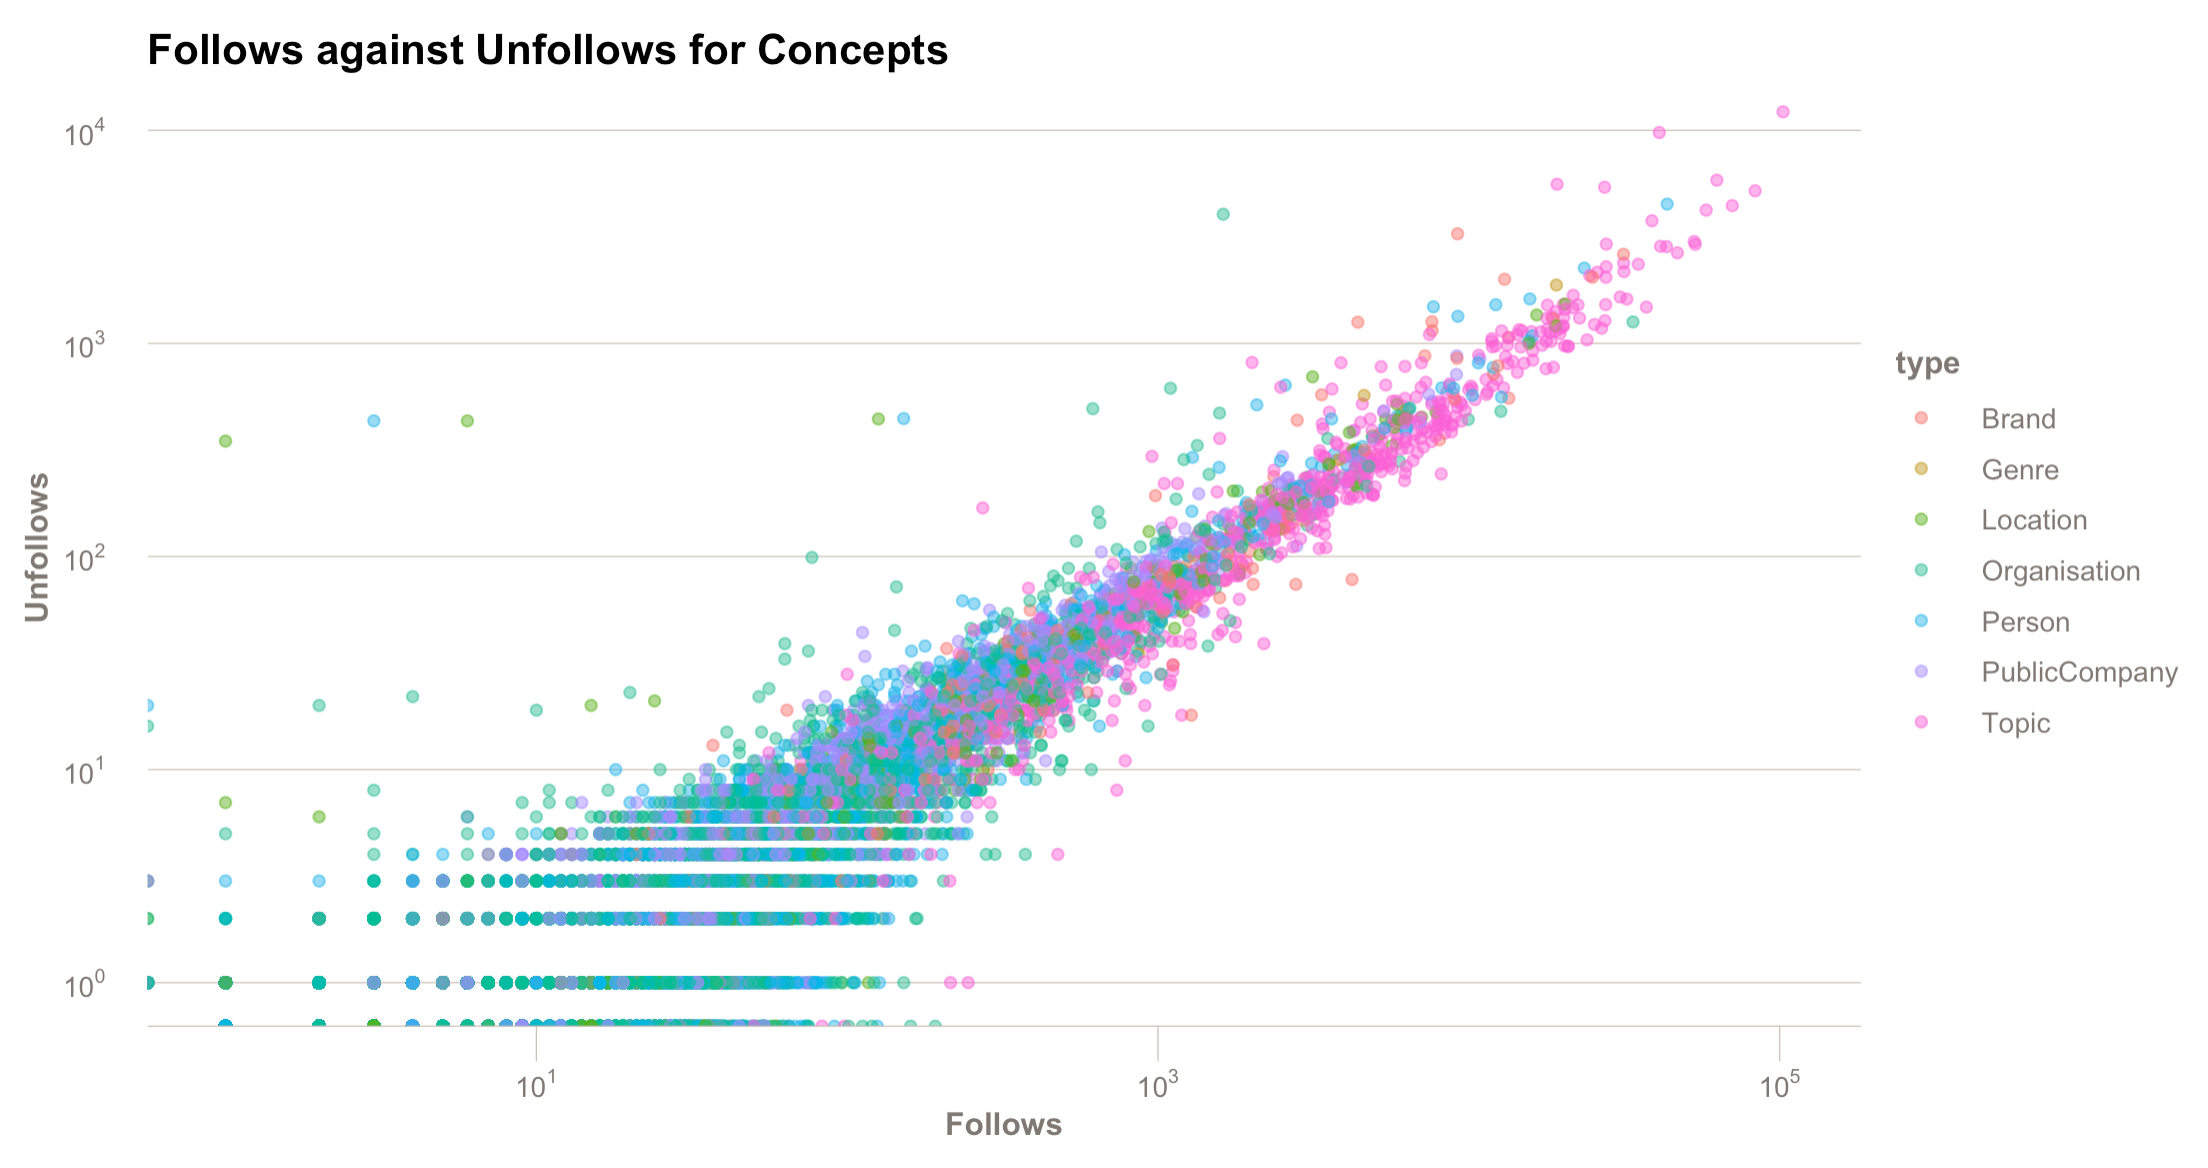
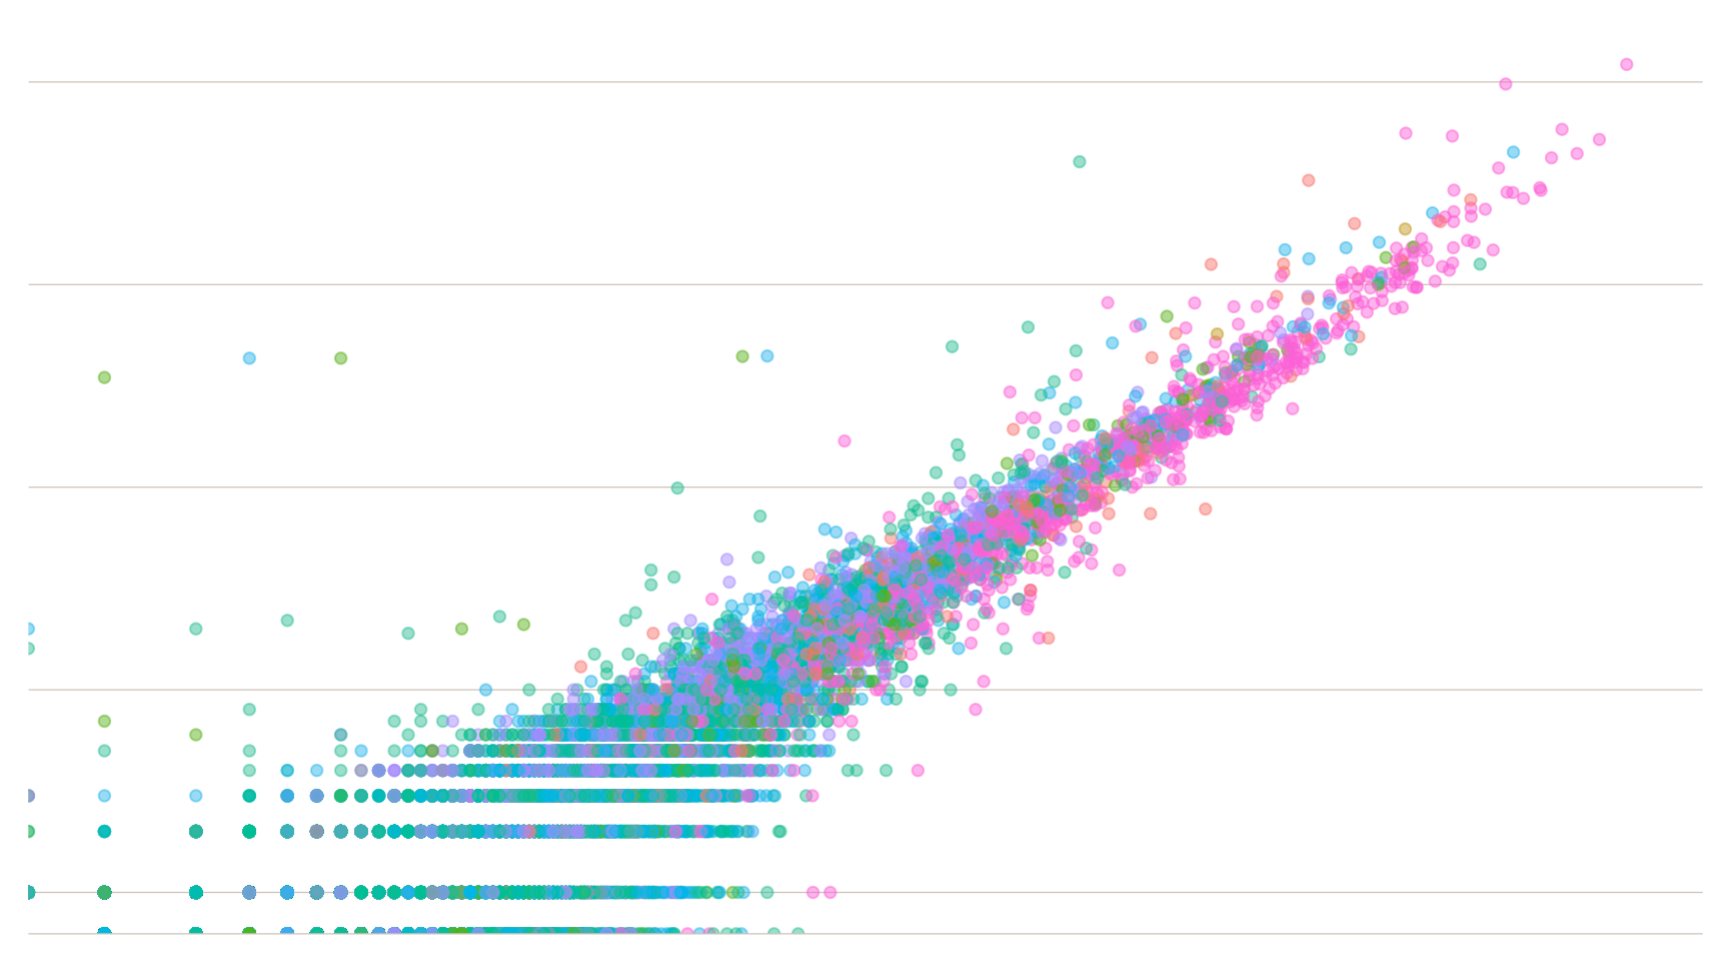
We mapped the number of user concept follows to the number of user concept unfollows to see if we could identify concepts that had a stronger (higher) follow to unfollow ratio count. Armed with this ratio count we could rank the clustered topic suggestions in order of other users voting with their digital feet.
The above graph helped us determine if a topic was more 'sticky', meaning it retains its gained users more than other concepts. Both axes are scaled by log10 to help visually spread out the interesting portion of the data. Somewhat annoyingly, the most dramatic portion of the graph, looking like a fragment of X ray crystallography, is simply an artefact of the log-scaling, and only covers topics with the fewest followers (and therefore of least interest).
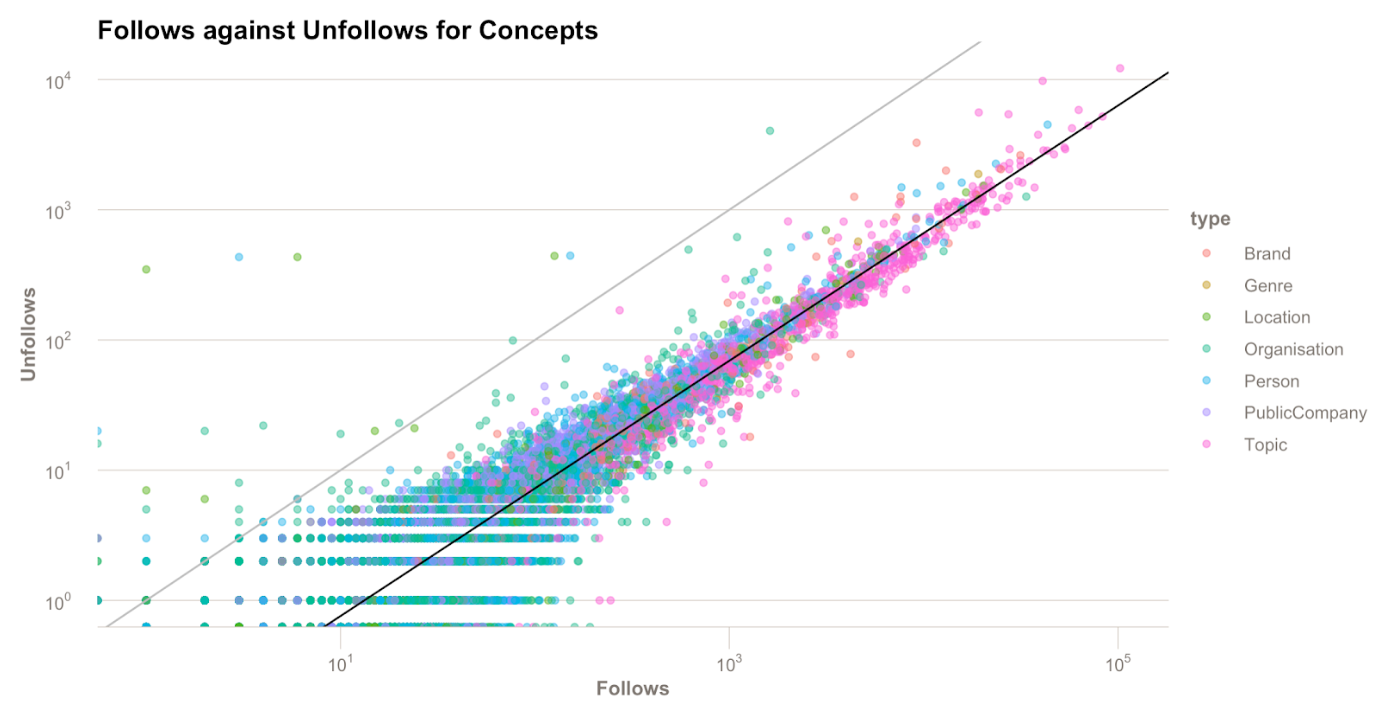
The light grey line is x=y, so any concepts on this line have exactly the same number of follows as unfollows. The black line is approximately marking the average 10:1 ratio of follows/unfollows each concept has. The further to the right of the black line a concept is, the greater proportion of follows it has.
This is far from a perfect ranking system. We discovered that due to some differences in tracking organic follows and organic unfollows we were not able to count organic unfollows with 100% confidence. Leading to concepts appearing on the left of the follow=unfollow grey line, which should not be possible.
We also discovered that while some topics have greater follow ratio, there could be other reasons not to push that to the top of the recommendations pile. Like when was the last time an article was published for this concept? Also there may be acceptable reasons for a large number of unfollows, for example the topic 'World Cup 2018' has seen a reduction in follows because the event has concluded.
This follows/unfollows ratio data gave us the first ranking filter we could use in the proposed recommendation algorithm. Now it was time to tackle our first crack at the FT Labs recommendation engine, known as Suggestr.
Suggestr
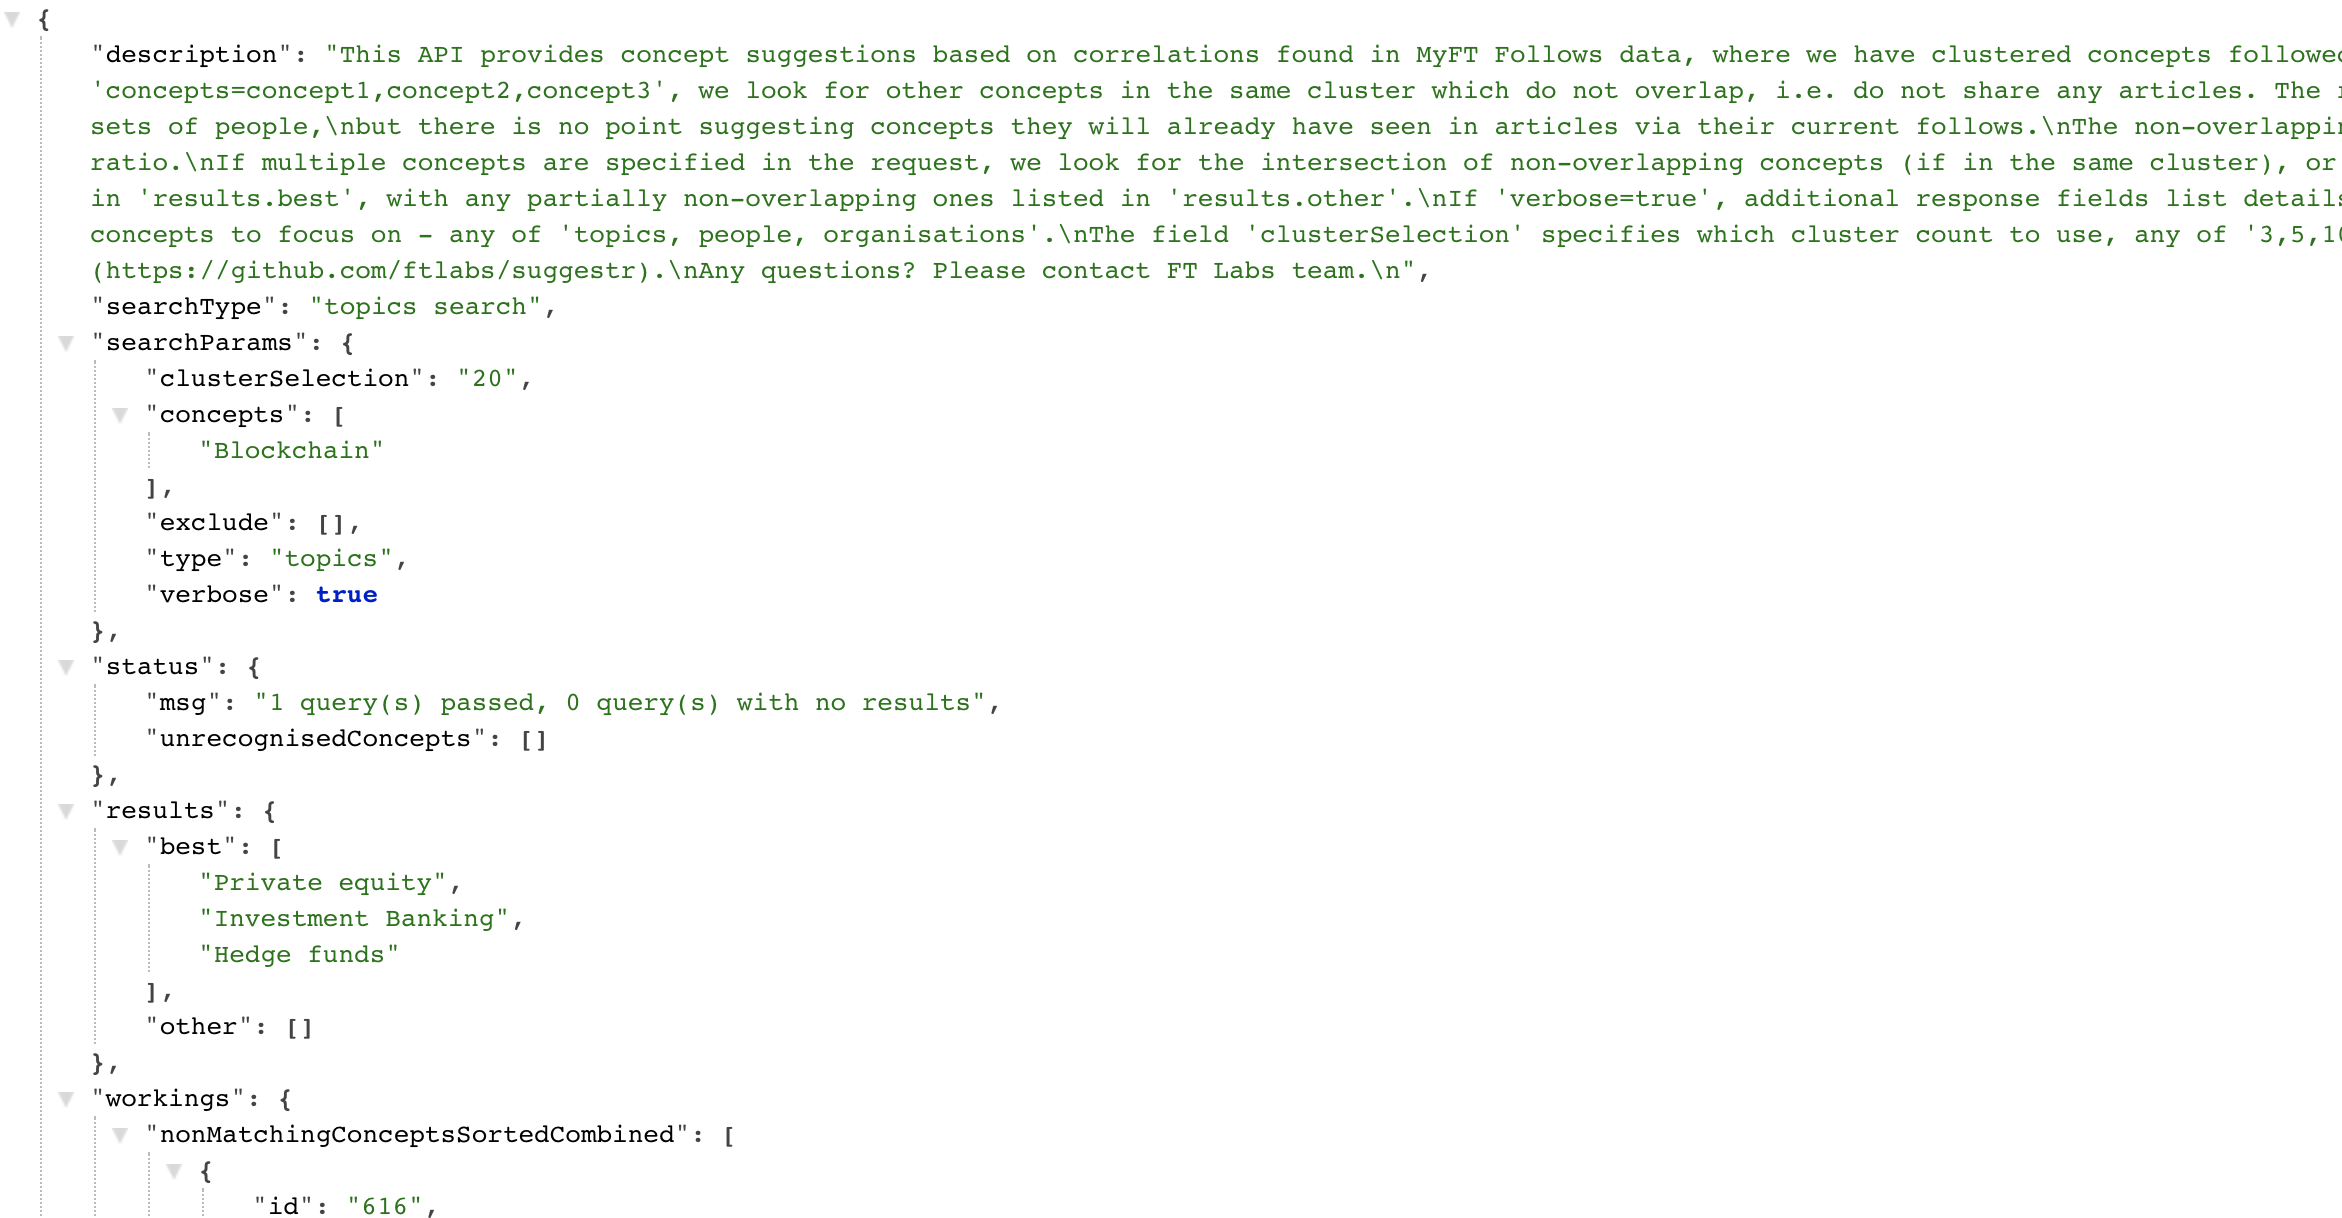
We built Suggestr as an endpoint that takes one or more FT topics as input and can suggest other topics of interest. We also included the correlation service, which also powered the correlations game, so that we could find topics that appear in the same cluster as the input topic(s), exclude topics that directly correlate and then rank the remaining with their follows/unfollow ratio. This way we suggest topics that don't appear in the same articles as the input topic but have been determined (by ML analysis of user interactions) to be of similar interest.
So Suggestr was born.
Suggestr's mission
Using topic cluster analysis, topic correlations data and topic follow/unfollow ratios - can we suggest retrieve topics to follow (or retrieve articles) for based on any given topic(s)?
The first prototype of Suggestr works well but we'd like to refine and add to the ranking filters before user (reader) testing can begin.
What did we learn?
All those ML & AI experts saying data prep is the largest time consumption percentage of the project weren't kidding. However all that time spent familiarised us with the data and allowed us to build effective tools to minimise time spent in future revisits.
If we don't record the data we have in a documented or understandable way that priceless data is basically number garbage. You need to be able to trust your data, to trust your analysis for your users to trust your output. So let your use of the recorded data shape the future recorded data, a cycle that will continue to improve your data (and projects) into the future.
"Every company has messy data, and even the best AI companies are not fully satisfied with their data." - Andrew Ng
It is difficult to generate recommendations based on a few metrics, you'll want as many as you can to shape the best suggestion. In the end there may be no good suggestions right now, and it's okay to say that rather than making a bad/false suggestion and losing the trust of a user.
Our bumbling around in the data helped other teams understand how tricky navigating it can be without help. Efforts are already underway to clarify and clean the data for everyone's use.
What does the future hold?
While currently on hold we look forward to completing Suggestr in the future and testing the quality of its recommendations against a live audience. There's an interest here at the FT to find recommendation models that fit each user best, or that users can pick and choose from.
We've also come a long way into understanding the capabilities and limitations of not only ML but our own data. We now have access to large relevant datasets with multitudes of possible investigations to help discover and support future projects.
We'd call that a win.